Key Points
1. Bitcoin’s Hash Ribbons indicator has issued a rare long-term buy signal, historically associated with miner capitulation bottoms and major market recoveries.
2. On-chain sentiment metrics are turning bullish, with the Fear and Greed Index forming a “golden cross” for the first time since mid-2025.
3. $90,000 has emerged as a critical psychological and technical support level that bulls must defend to avoid a deeper correction.
Miner capitulation sends long-term buy signal
Bitcoin’s mining sector is once again providing a constructive signal for long-term investors. The Hash Ribbons indicator, which compares the 30-day and 60-day moving averages of the network’s hashrate, has flipped into what Capriole Investments describes as a “long-term buying opportunity.”
This signal appears when the short-term hashrate average drops below the longer-term trend, a pattern that has historically aligned with periods of miner capitulation. During these phases, inefficient miners are forced offline, selling pressure peaks, and the market often transitions toward recovery.
On-chain analytics firm On-Chain Mind echoed the assessment, calling the current reading “one of the largest Hash Ribbons signals on record.” According to the firm, miner capitulation followed by stabilization has repeatedly marked the exhaustion of forced selling rather than the start of prolonged downtrends.
The most recent comparable signal emerged in July 2025, ahead of a roughly 25% rally that carried bitcoin from around $98,000 to a new all-time high near $123,200.
Sentiment indicators begin to turn
Beyond mining data, market psychology is also shifting. The Fear and Greed Index has generated what analysts describe as a bullish “golden cross,” where the 30-day moving average of sentiment crosses above the 90-day average for the first time since May 2025.
CryptoQuant analyst MorenoDV_ noted that this pattern has historically coincided with transitions from corrective phases into renewed uptrends. While sentiment indicators are not timing tools on their own, they often reinforce structural signals coming from on-chain data when both align.
Taken together, miner behavior and sentiment trends suggest the market may be entering a phase where downside risk is diminishing and longer-term accumulation becomes more attractive.
Why $90,000 matters
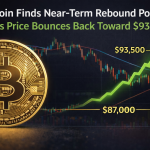
Despite improving indicators, price structure remains decisive. Bitcoin is currently trading within a narrow $90,000 to $92,000 range, making the $90,000 level a key battleground.
Market analysts widely view this zone as critical. It has acted as support in previous pullbacks, and holding it would reinforce the broader bull market structure. A decisive weekly close below $90,000, however, could shift momentum negatively.
In that scenario, traders are watching the $80,000 to $85,000 region as the next major demand zone. Further downside could expose deeper historical levels, including the April 2025 low near $74,500 and the 200-week moving average around $68,000. In a more extreme bearish extension, some measured-pattern projections point toward the mid-$50,000s as a potential bottom.
The balance of probabilities
For now, the weight of evidence favors caution with a bullish bias. Miner capitulation signals, improving sentiment, and consolidation above a major psychological level all suggest bitcoin may be forming a base rather than rolling over into a full bear phase.
Whether that base turns into the next leg higher depends largely on one factor: the market’s ability to keep $90,000 intact. If it does, the current signals may be remembered as another textbook accumulation window within a broader bull cycle.
Comparison, examination, and analysis between investment houses
Leave your details, and an expert from our team will get back to you as soon as possible


Alright, TX388bet, Texas represent! Betting online can be awesome, but always game responsibly and know the limits. Good luck to all playing from Texas! tx388bet
PBV88asia, eh? Asia? Hmmm. Need to explore some eastern flavour. Trying it later. Have you check it? Find out at pbv88asia.
MX711casino? Heard their ad. Let me try! You also should try it! Then we can exchange tips together at mx711casino.
[6741]W19 Casino Philippines: The Best Legit Online Gambling & Slots via GCash Experience W19 Casino Philippines, the premier destination for the best online gambling PH has to offer. Secure your w19 login registration today to enjoy a legit online casino GCash experience featuring high-payout w19 slots and live casino games. Join the most trusted and reliable gaming platform in the Philippines for seamless transactions and elite entertainment. visit: w19
[9038]The Leading Online Casino and Slots Platform in the Philippines visit: jl16login
[1775]WJPESO: The Best Online Casino in the Philippines. Easy Login, Register & App Download for Premium Slots and Big Wins. Experience WJPESO, the best online casino in the Philippines. Secure WJPESO login and register to enjoy premium WJPESO slots and big wins. Start your WJPESO app download now for a premium gaming experience anytime, anywhere! visit: wjpeso
[4568]okfun Casino Philippines: Best okfun Slot Games, Easy okfun Login, Register, and App Download. Join okfun Casino Philippines for the best okfun slot games! Enjoy a seamless okfun login, fast okfun register process, and secure okfun download for our mobile app. Experience top-tier gaming and big wins at the premier okfun casino destination in the Philippines. visit: okfun
[8677]WK77 Online Casino Philippines: Fast WK77 Login, Register & Slot Link. Download the WK77 App for the Best PH Gaming Experience. Experience the best PH gaming at WK77 Online Casino. Fast WK77 login and WK77 register for top rewards. Use the WK77 slot link or WK77 app download to start winning today! visit: wk77
[7120]BBCCasino Official Site: Best Online Slots in the Philippines. Fast BBCCasino Login, Easy Register, and Mobile App Download for the Ultimate Gaming Experience. Experience top gaming at BBCCasino official site. Fast BBCCasino login, easy register, and BBCCasino app download. Play the best online slots in the Philippines today! visit: bbccasino
[200]Kingjl Login & Register: Top Philippines Online Casino, Kingjl Slot & App Download Experience the best at Kingjl, the #1 Philippines online casino! Complete your Kingjl login or Kingjl register to play premium Kingjl slot games. Enjoy secure gaming and get the Kingjl app download for big wins on the go! visit: kingjl
[4264]Winph8 Online Casino Philippines: Secure Winph8 Login, Fast Register & App Download for Premium Slot Games. Join Winph8 Online Casino Philippines for premium Winph8 slot games. Enjoy a secure Winph8 login, fast Winph8 register, and easy Winph8 app download. Experience the ultimate gaming platform and start winning today! visit: winph8
[2314]Peso99: The Philippines’ Best Online Casino for Slots and GCash Gambling visit: peso99
[1148]PHPark Official Site: Best Slots in the Philippines. Login, Register, & App Download Now. Experience PHPark, the official site for the best slots in the Philippines. Secure your phpark login, complete your phpark register, and get the phpark app download now to start winning on premium phpark slots! visit: phpark