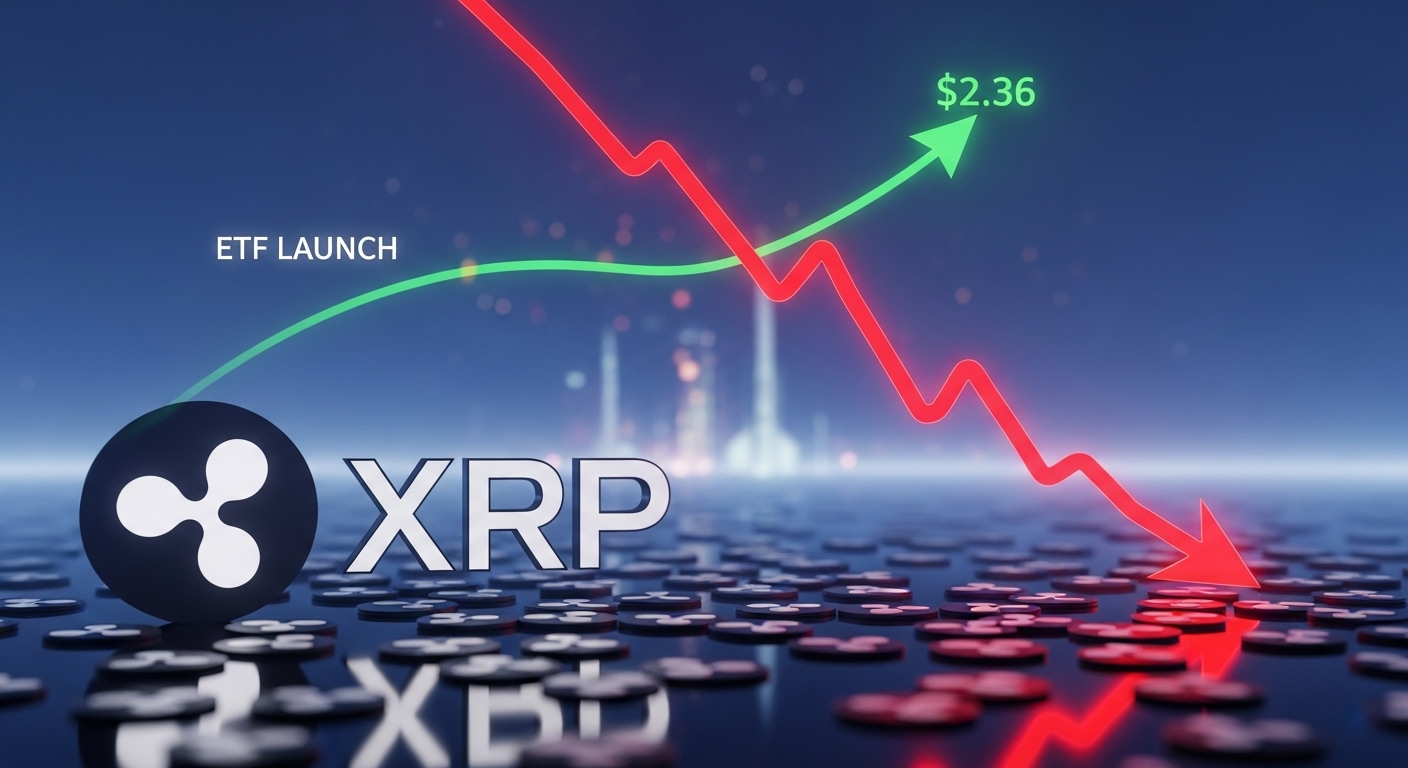
XRP extended its multi-week downturn on Tuesday as intense selling pressure sent the token tumbling 7.3%, breaking through several key support levels and settling near $2.30. The move erased recent gains and highlighted deep structural weakness across the broader crypto market.
The decline arrived on the same day the first U.S. spot XRP exchange-traded fund—Canary Capital’s XRPC—officially went live on Nasdaq. While the ETF listing marks a landmark moment for institutional XRP exposure, its debut occurred in the middle of a broad risk-off shift, overshadowing the milestone with aggressive distribution.
Market sentiment remains fragile, with analysts warning that XRP’s latest drop may represent only a temporary pause in a still-developing macro-driven downtrend.
ETF Launch Overshadowed by Heavy Selling
XRP’s sharp slide came as crypto markets remain locked in a medium-term corrective phase. FxPro senior analyst Alex Kuptsikevich noted that conditions continue to resemble “a short-term rebound inside a larger decline,” leaving assets vulnerable to deeper retracements.
On-chain activity added to the caution: 110.5 million XRP moved between unknown wallets in the hours surrounding the breakdown, a level of whale transfer activity that often precedes further volatility.
Despite the historic listing of XRPC, institutional demand has yet to offset broad selling pressure. Whether the ETF ultimately becomes a net inflow catalyst or simply a liquidity event will hinge on early trading volumes and appetite from large allocators.
Price Action: Breakdown Turns Violent Under Liquidation Pressure
XRP fell from $2.48 to $2.30 across the session, cutting through support at $2.47, $2.40, and $2.36 as a high-volume unwind took hold.
Key session metrics:
-
Range: $0.23 (spanning 9.2%)
-
Total volume: 157.9M XRP (+46% above average)
-
Breakdown sequence: 04:32–04:35 UTC
-
Selling climax: 4.06M XRP in one minute at 04:32 (254% above baseline)
Liquidity briefly evaporated immediately after the breakdown, with order books thinning so sharply that price went flat for nearly a full minute—an indicator of halted flows or severe depth fragmentation.
Attempts to recover above $2.31 repeatedly failed, leaving XRP pinned in a tight $2.30–$2.32 range into the close.
Technical Landscape: Structure Breaks as $2.29 Becomes Line in the Sand
All major technical signals now point to a confirmed structural breakdown:
Support & Resistance
-
Primary support: $2.29–$2.30
-
Key resistance: $2.36 (must be reclaimed to invalidate breakdown)
-
Additional resistance layers: $2.40 and $2.47
Volume Profile
-
+46% total volume increase confirms institutional-grade distribution
-
254% liquidation spike typical of forced-selling cascades
-
No recovery volume—no sign of buyers defending higher levels
Chart Structure
-
Descending triangle support fully failed
-
New range forming between $2.29–$2.33
-
Structure aligns with ongoing mid-term downtrend in crypto indices
Momentum
-
Oversold signals appearing intraday
-
But EMAs maintain strong bearish slope
-
No bullish divergence confirmed yet
What Traders Should Watch Next
XRP’s next move will hinge on several key factors:
1. $2.29 Support
This is the most important level on the chart.
A breakdown here exposes a swift move toward the $2.00–$2.20 demand zone.
2. Reclaiming $2.36
A close above $2.36 would signal the first legitimate bullish reversal attempt.
3. XRPC ETF Inflows
Early ETF volume will reveal institutional sentiment:
-
High inflows: accumulation opportunity
-
Low or negative flows: ETF used as liquidity exit
4. Whale Transfers
The 110.5M XRP transferred during the breakdown is a major wildcard.
Exchange inflows from these wallets would confirm additional downside risk.
5. Macro Conditions
Crypto beta remains tightly tied to:
-
Liquidity stress
-
Treasury yields
-
Risk-on/risk-off rotations
-
Volatility spikes across equities
XRP, historically more sensitive to liquidity shocks, could outperform on recovery—or underperform if macro pressure persists.


https://shorturl.fm/lfYSo
https://shorturl.fm/Ep4Rp