Home Finance XRP Consolidates at $3: Triangle Pattern Signals Potential Breakout or Breakdown
Finance

XRP Consolidates at $3: Triangle Pattern Signals Potential Breakout or Breakdown

Share
Share

XRP is currently trading around $3.00, forming a symmetrical triangle pattern on its daily chart. This technical formation suggests that a significant price movement is imminent, with potential targets at $3.30 on the upside or $2.65 on the downside.

Technical Analysis: Symmetrical Triangle Formation

The symmetrical triangle pattern is characterized by converging trendlines, indicating a period of consolidation before a breakout or breakdown. XRP’s price has been oscillating between approximately $2.65 and $3.20, tightening within this range. A decisive move beyond these boundaries is expected to set the direction for the next significant price move.

Key Levels to Watch

  • Resistance at $3.30: A breakout above this level would confirm bullish momentum, potentially leading XRP towards $4.00–$5.00. Analysts suggest that such a move could be supported by Fibonacci extensions and prior highs.

  • Support at $2.65: A breakdown below this level could indicate a bearish trend, with potential targets around $2.50 and $2.00. This would suggest a 10% decline and expose further downside risk.

Market Sentiment and Investor Behavior

The current consolidation phase reflects a balance between buying and selling pressures. Investors are closely monitoring the $3.30 resistance and $2.65 support levels, as a breakout or breakdown could trigger increased trading volumes and volatility.

Outlook: Preparing for Potential Volatility

As XRP approaches the apex of the symmetrical triangle, traders should be prepared for potential volatility. A breakout above $3.30 could lead to a bullish rally, while a breakdown below $2.65 could initiate a bearish trend. Monitoring volume and momentum indicators will be crucial in assessing the strength of any price movement.

Share

1 Comment

Leave a Reply to Tomas1623 Cancel reply

Your email address will not be published. Required fields are marked *

Don't Miss

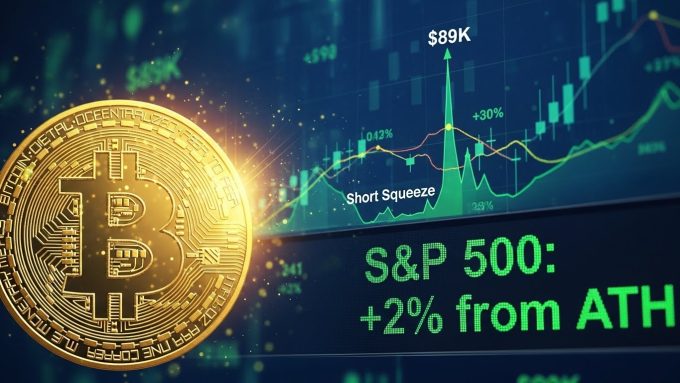
SKN | Bitcoin Analysis Flags $89K Short Squeeze as S&P 500 Nears New Record

Bitcoin held steady near the $87,000–$88,000 zone on Wednesday as analysts highlighted mounting short-liquidation levels that could pull BTC toward $89,000, even as...

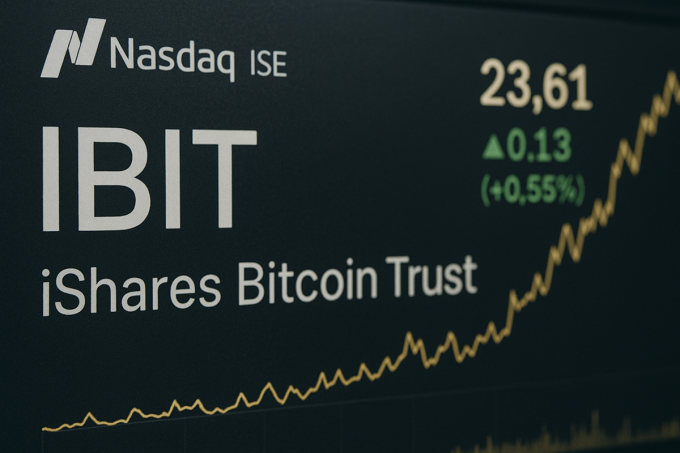
SKN | Nasdaq ISE Moves to Raise Option Limits on BlackRock’s IBIT as Institutional Demand Accelerates

Nasdaq’s International Securities Exchange (ISE) has filed to elevate option position limits on BlackRock’s iShares Bitcoin Trust (IBIT), aiming to place the ETF...

Related Articles

SKN | Digital Asset Treasuries Lead Crypto Stock Sell-Off as Bitcoin Slides to $84K

Market Overview Crypto stocks opened December in the red as Bitcoin fell...

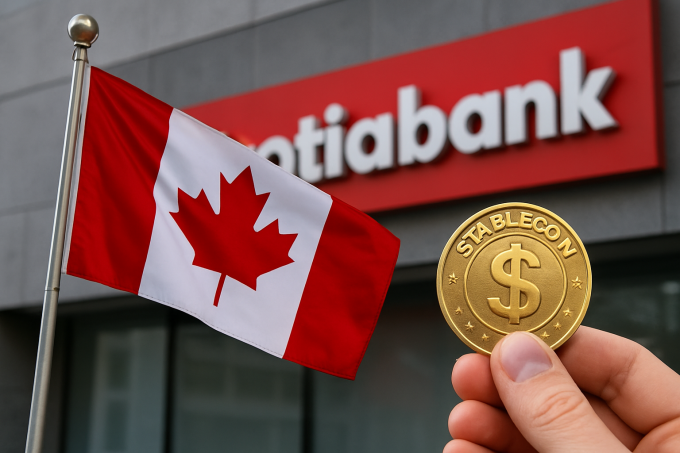
SKN | Canada Advances Stablecoin Rules as Scotiabank Sees Limited Market Impact

Market Outlook Canada’s move toward stablecoin regulation is drawing attention across the...

SKN | BitMine Accumulates 97 K ETH Ahead of Fusaka upgrade, Sees Fed Pause as Tailwind

BitMine Immersion Technologies — chaired by veteran strategist Tom Lee — disclosed...

SKN | Strategy Still the Premier Bitcoin Proxy, Benchmark Says, Rejecting ‘Doom’ Narrative

Strategy (formerly known as MicroStrategy) remains the market’s leading publicly traded proxy...